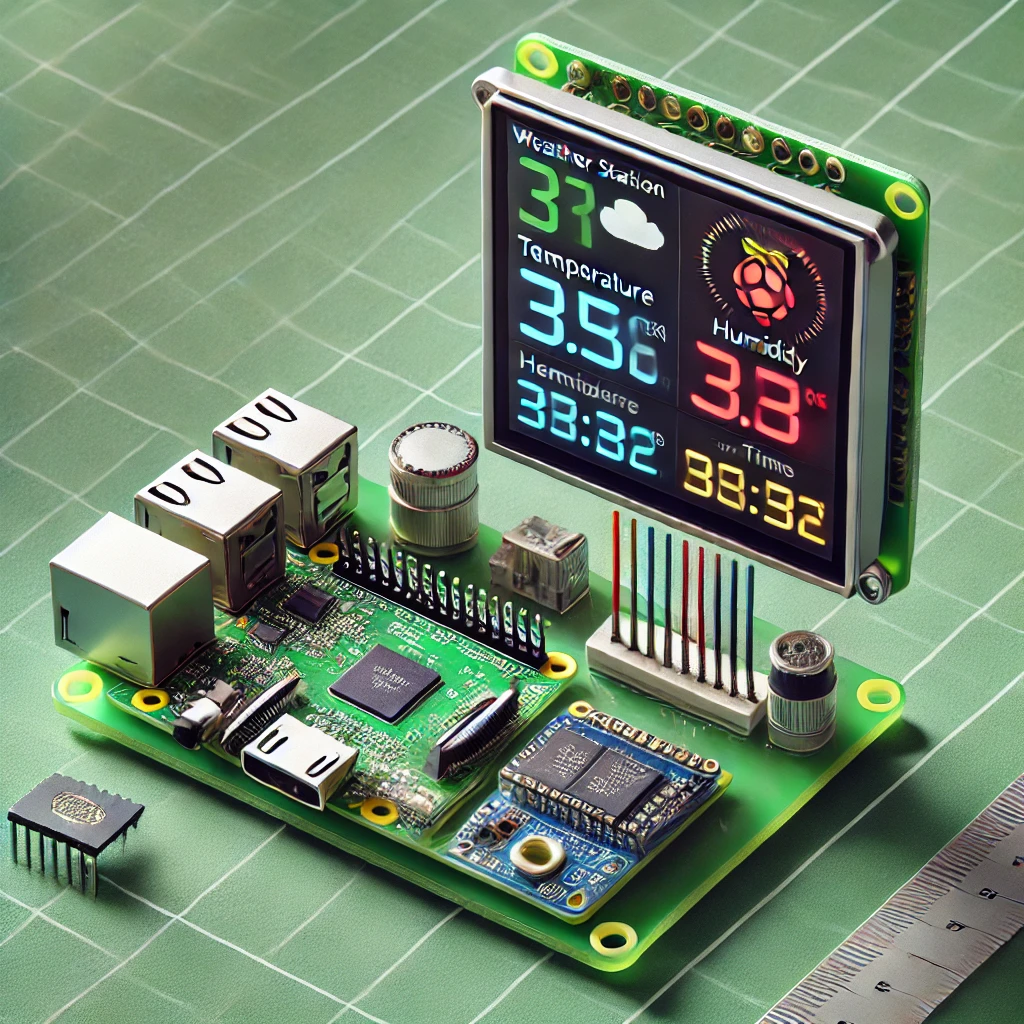
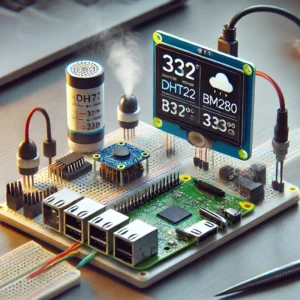
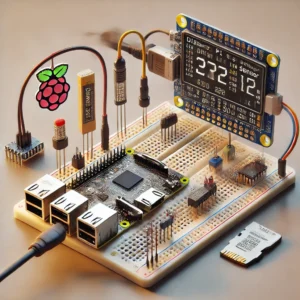
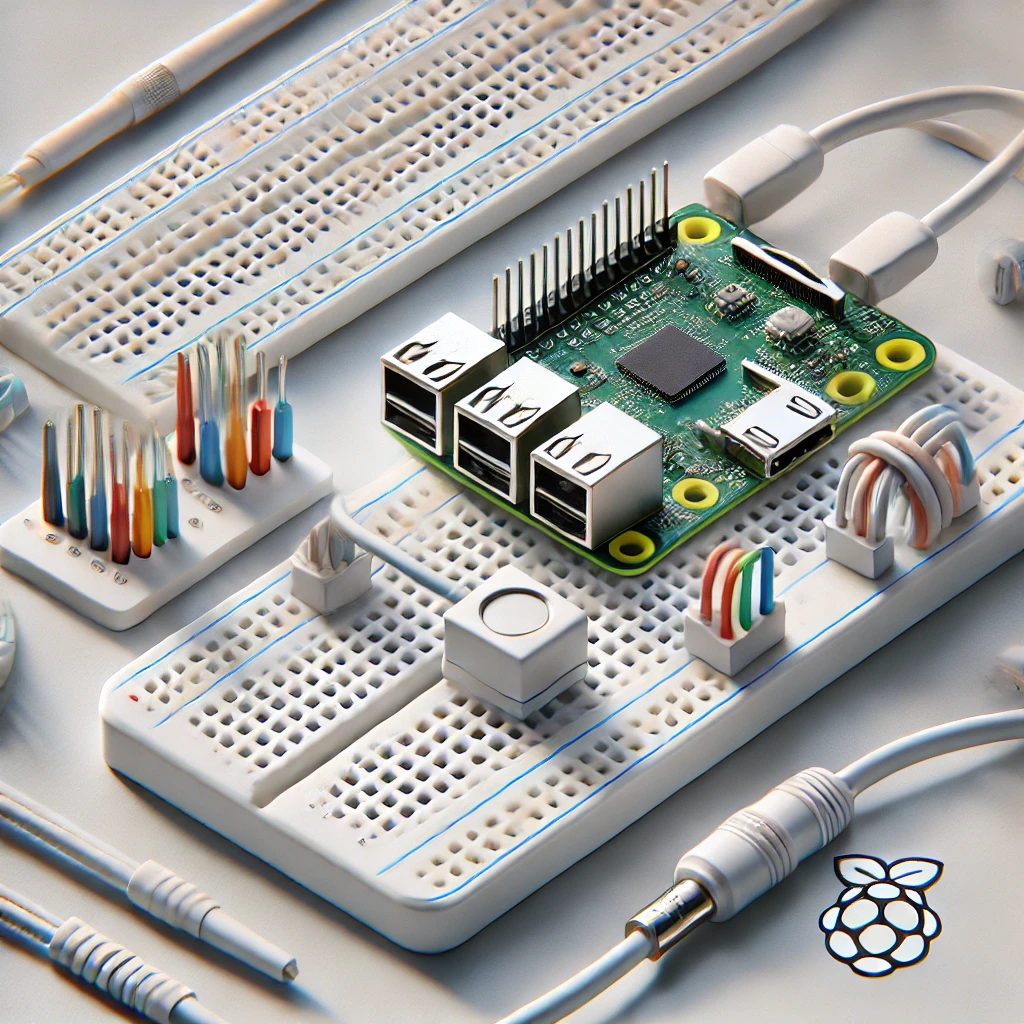
Monitor real-time weather data with a Raspberry Pi Pico H-based weather station. Using temperature, humidity, and pressure sensors, this project collects and displays data on an OLED screen, making it a practical and educational way to learn environmental monitoring and microcontroller programming.
Introduction to the Real-Time Weather Station Project
Weather stations are invaluable tools for monitoring environmental conditions, and creating one from scratch provides insight into programming, sensor integration, and data display. Using the Raspberry Pi Pico H, we’ll build a weather station that collects data from temperature, humidity, and pressure sensors, and displays it on an OLED screen. This setup is useful for home weather monitoring, educational purposes, or as an IoT project.
Components Needed for the Weather Station
To build this weather station, you’ll need the following components:
- Raspberry Pi Pico H: The microcontroller for reading sensor data and controlling the display.
- DHT22 or DHT11 Temperature and Humidity Sensor: Measures temperature and humidity levels.
- BMP280 or BME280 Pressure Sensor: Measures atmospheric pressure; the BME280 model also measures temperature and humidity.
- 0.96-inch OLED Display (I2C): Displays the data collected from the sensors.
- Jumper Wires: For connecting components.
- Breadboard: To organize connections.
These components are affordable and readily available, making this project accessible to beginners interested in environmental monitoring.
Setting Up the Raspberry Pi Pico H with MicroPython
We’ll use MicroPython to program the Raspberry Pi Pico H. Connect the Pico H to your computer, open Thonny IDE, and set the interpreter to “MicroPython (Raspberry Pi Pico).” If needed, follow Thonny’s prompts to install MicroPython on your Pico H. This setup will allow us to program and test the weather station in real-time.
Understanding the Weather Station Components
Each sensor in the weather station has a specific role:
- DHT22 or DHT11 Sensor: Measures temperature and humidity.
- BMP280 or BME280 Sensor: Measures air pressure and, if using the BME280, additional temperature and humidity data.
- OLED Display: Shows the real-time weather data, making the station easy to read at a glance.
By combining these sensors, we’ll create a system that provides a comprehensive snapshot of environmental conditions.
Wiring the DHT22 Sensor to the Raspberry Pi Pico H
The DHT22 or DHT11 has three main pins: VCC, GND, and DATA. Here’s how to connect it:
- VCC: Connect to the 3.3V output on the Pico H.
- GND: Connect to a GND pin on the Pico H.
- DATA: Connect to GPIO pin GP15 on the Pico H.
The DATA pin transmits temperature and humidity readings as digital data to the Pico H.
Wiring the BMP280/BME280 Pressure Sensor
The BMP280/BME280 uses I2C for data transmission, making it easy to connect multiple devices. Here’s how to wire it:
- VCC: Connect to 3.3V on the Pico H.
- GND: Connect to GND on the Pico H.
- SCL: Connect to GP17 (I2C0 SCL) on the Pico H.
- SDA: Connect to GP16 (I2C0 SDA) on the Pico H.
This setup allows the Pico H to read pressure, temperature, and, if using BME280, humidity data over the I2C protocol.
Wiring the OLED Display to the Raspberry Pi Pico H
The OLED display also uses I2C, so it shares the SCL and SDA connections with the BMP280/BME280. Connect the OLED as follows:
- VCC: Connect to 3.3V on the Pico H.
- GND: Connect to GND on the Pico H.
- SCL: Connect to GP17 (shared with the BMP280/BME280).
- SDA: Connect to GP16 (shared with the BMP280/BME280).
With I2C, we can easily connect multiple devices on the same data line, simplifying wiring.
Installing Necessary Libraries in MicroPython
To interface with the DHT22, BMP280/BME280, and OLED display, install the following libraries in Thonny:
dht.pyfor the DHT22.bmp280.pyorbme280.pyfor the pressure sensor.ssd1306.pyfor the OLED display.
Upload these libraries to your Raspberry Pi Pico H to allow for easy sensor data reading and display control.
Writing Code to Read Temperature and Humidity
The following code initializes the DHT22 and reads temperature and humidity data:
This function reads data from the DHT22 sensor and returns temperature and humidity values.
Writing Code to Read Pressure from the BMP280/BME280
To read pressure data, initialize the BMP280/BME280 and create a function to get pressure readings.
This code reads the atmospheric pressure in Pa (Pascal) from the BMP280 sensor.
Displaying Data on the OLED Screen
Initialize the OLED screen using the ssd1306 library and display temperature, humidity, and pressure readings.
This function clears the display, writes the latest readings, and updates the screen.
Combining Code to Build the Weather Station
Now, combine all functions to continuously read sensor data and update the OLED display.
This main loop reads the sensors and updates the display every two seconds, providing near real-time data.
Testing the Weather Station System
Power up the system and test each sensor by observing the OLED display. Verify that the temperature, humidity, and pressure readings appear correctly and are updated every few seconds.
Calibrating and Adjusting Sensor Thresholds
Calibrate your weather station by comparing readings with a reliable source, such as an online weather service or professional weather station. Adjust any discrepancies to ensure accuracy, especially for the pressure and temperature sensors.
Adding Data Logging to the Weather Station
For continuous monitoring, add an SD card module to log data over time. Connect the SD card to the SPI interface, and use the following code to log data:
This function appends each reading to a file on the SD card, allowing you to review weather trends over time.
Expanding the Project with IoT and Remote Monitoring
Expand the weather station with remote monitoring by adding an ESP8266 Wi-Fi module. Use the ESP8266 to send data to a cloud platform, such as Thingspeak, for online access and analysis.
Replace YOUR_API_KEY with your Thingspeak API key, and use send_data(temp, hum, pressure) in the main loop to periodically send data to the cloud.
Building a real-time weather station with Raspberry Pi Pico H is an excellent project for anyone interested in environmental monitoring and IoT. This setup provides real-time insights into temperature, humidity, and atmospheric pressure, making it a valuable educational tool or a practical addition to your home. By expanding with data logging and remote monitoring, you can create a more robust and versatile weather station that can be used for long-term data analysis. This project is an ideal starting point for further IoT exploration and environmental science applications.
Please check out our other website, where you can learn how to 3D print some of the things needed for this project. https://master3dp.com/

