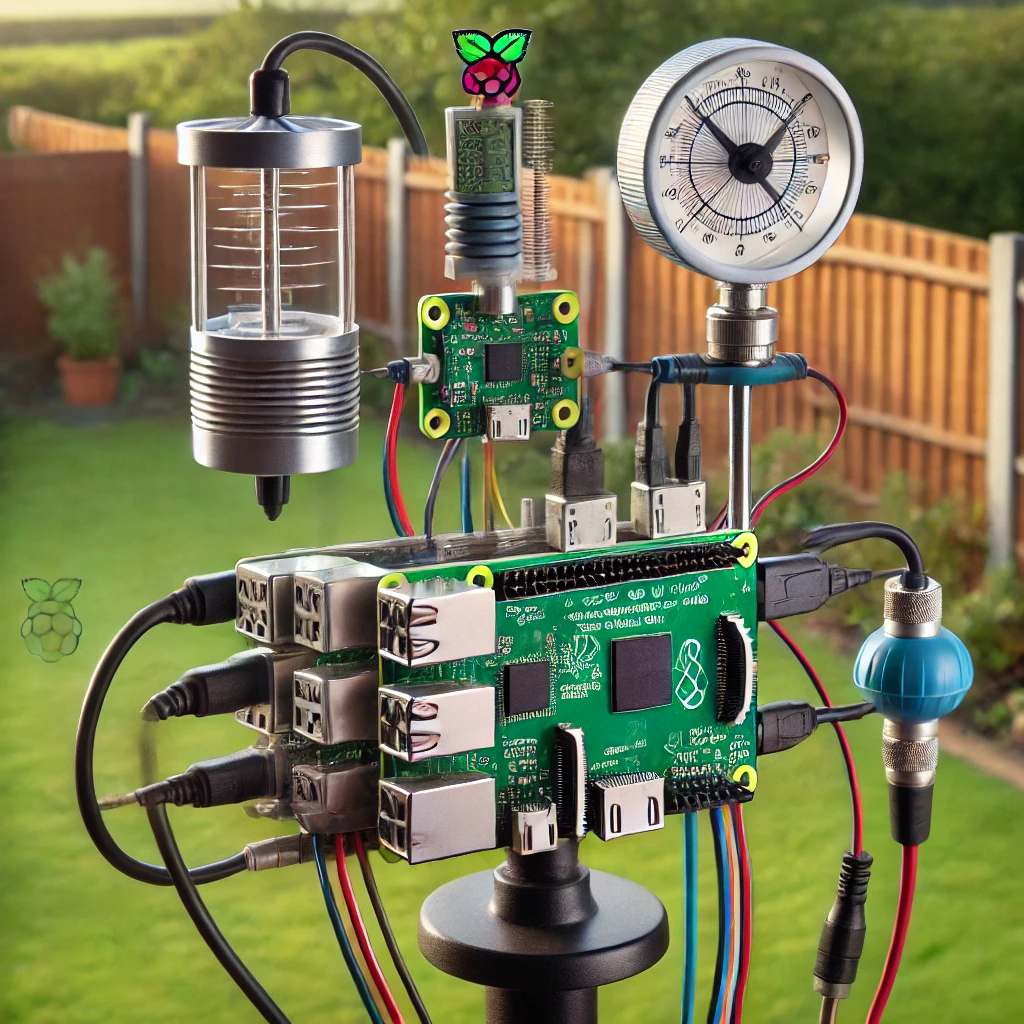
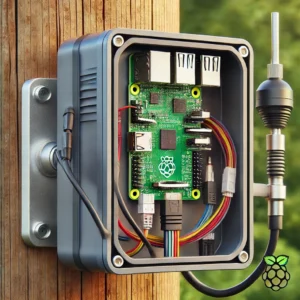
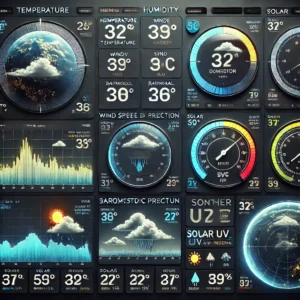
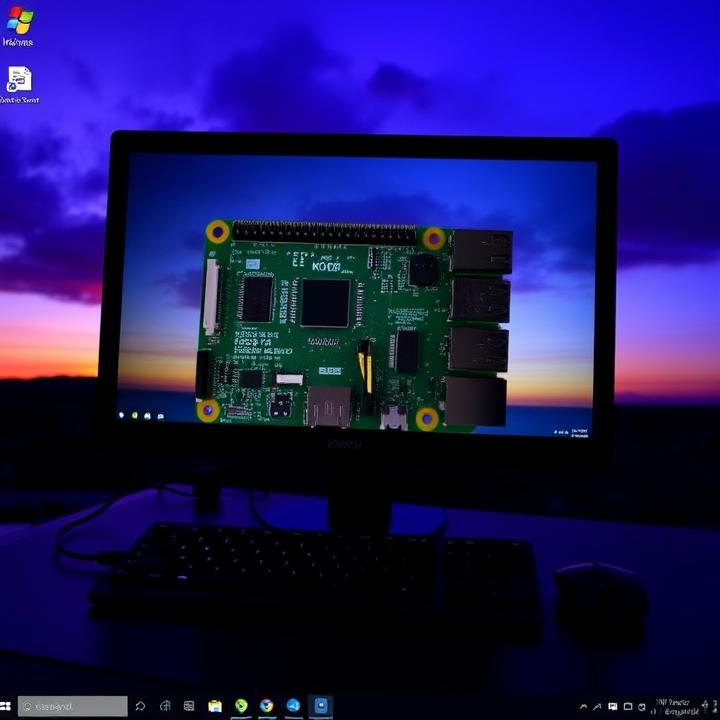
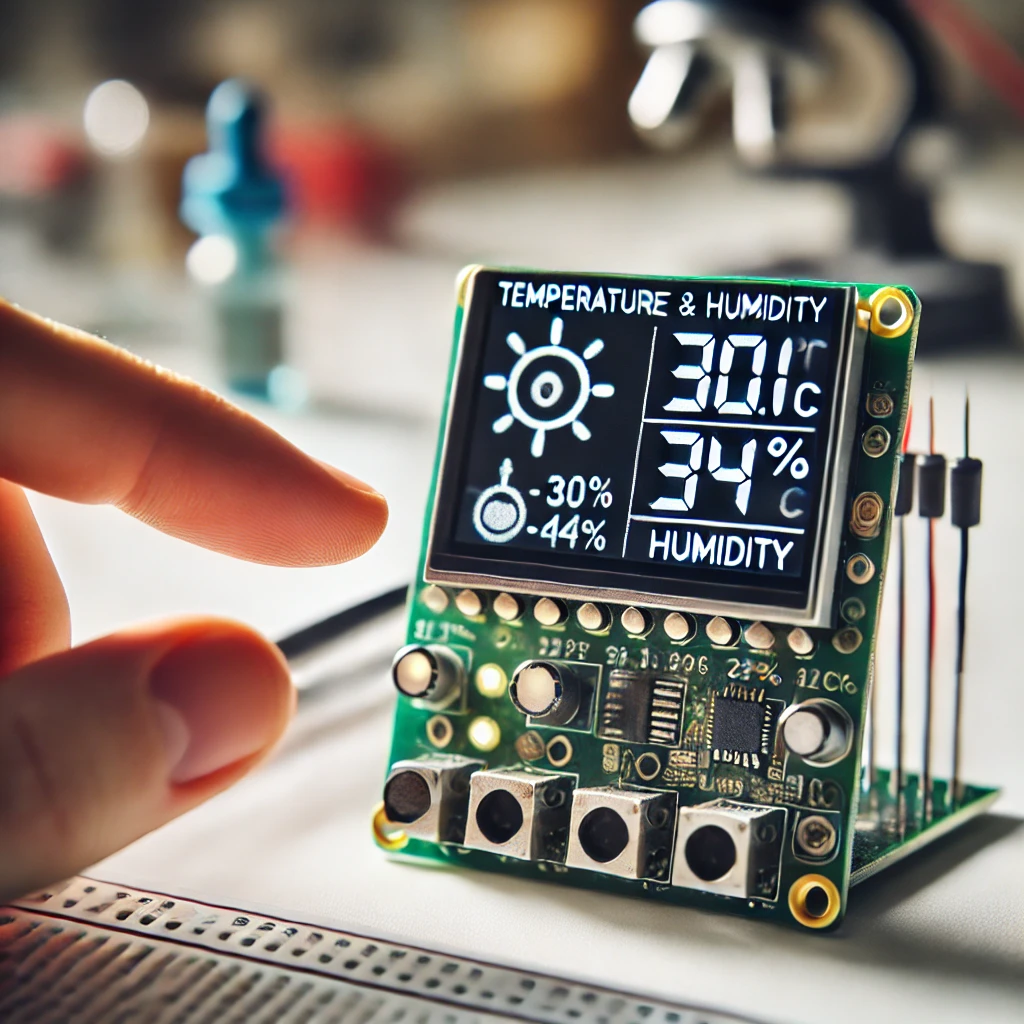
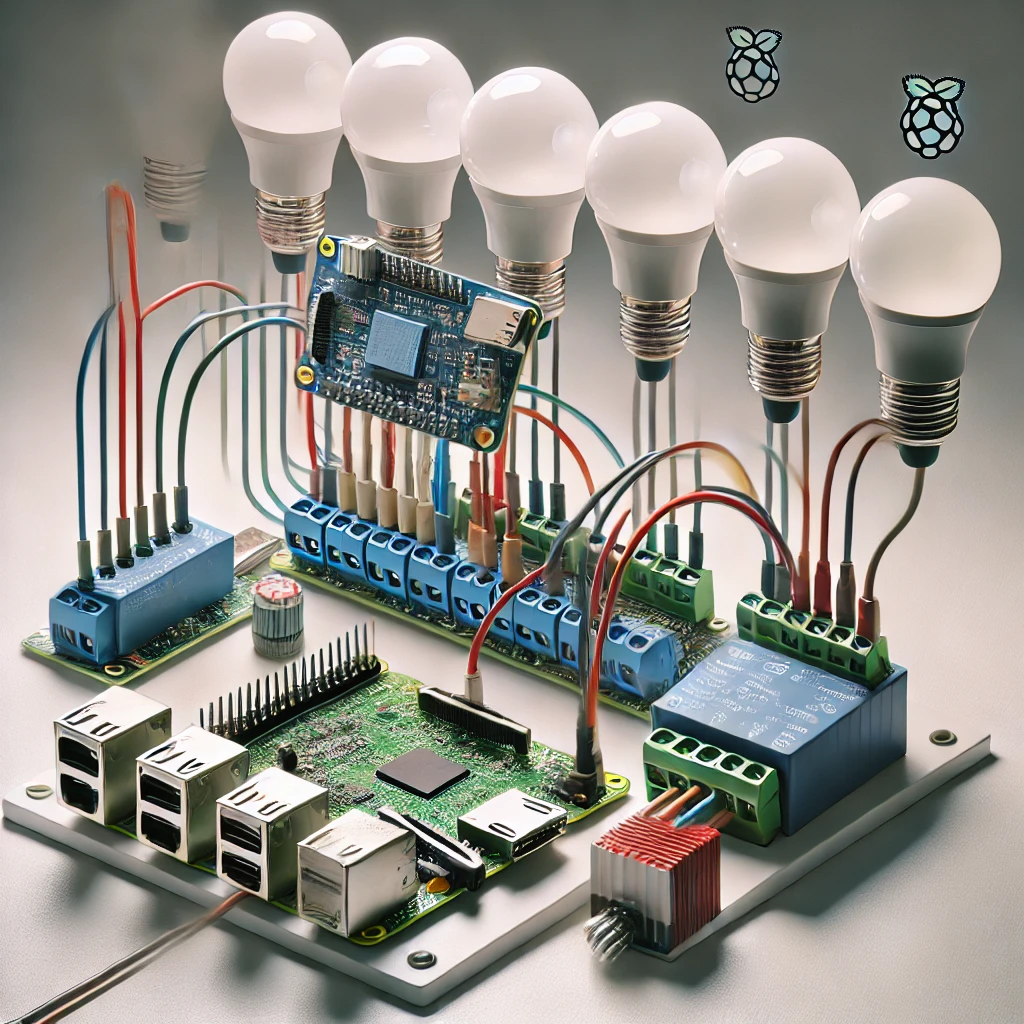
Learn how to build a personal weather station using Raspberry Pi 5 to monitor temperature, humidity, and atmospheric pressure in real-time. This guide covers essential components, sensor setup, coding, and data visualization. Perfect for DIY enthusiasts, this project offers valuable insights into weather patterns while enhancing your skills in electronics and programming.
Personal Weather Station
Weather monitoring is a practical and enjoyable project for DIY enthusiasts and tech hobbyists. With the Raspberry Pi 5, setting up a personal weather station at home becomes both affordable and accessible. A personal weather station not only provides real-time local weather data but also offers insights into environmental conditions and patterns over time, making it ideal for gardening, science experiments, or simply keeping track of the weather.
This guide walks you through the process of setting up a personal weather station using the Raspberry Pi 5, covering everything from selecting sensors to coding, data visualization, and even adding cloud-based storage for long-term data analysis.
Why Choose Raspberry Pi 5 for a Personal Weather Station?
The Raspberry Pi 5 is equipped with features that make it suitable for collecting and processing environmental data:
- Enhanced Processing Power: The Pi 5’s quad-core processor can handle data from multiple sensors simultaneously, allowing for real-time data processing.
- GPIO Pins: The GPIO (general purpose input/output) pins allow the Pi 5 to connect with various sensors, such as temperature, humidity, and pressure sensors.
- Low Power Consumption: Running 24/7 with minimal power usage, the Pi 5 is ideal for continuous environmental monitoring.
- Affordability: The Raspberry Pi 5 offers a cost-effective solution compared to commercial weather stations while providing customization options.
Essential Components for the Weather Station
- Raspberry Pi 5: The core device to process sensor data.
- MicroSD Card (32GB or higher): Storage for the OS, software, and data.
- Power Supply (USB-C): Stable power for the Raspberry Pi.
- Temperature and Humidity Sensor (DHT22): For measuring ambient temperature and humidity.
- Barometric Pressure Sensor (BMP280): For measuring atmospheric pressure.
- Light Sensor (optional): To monitor light intensity, useful for tracking daylight patterns.
- Jumper Wires: Connect sensors to the GPIO pins on the Raspberry Pi.
- Display (optional): An LCD or LED display to view real-time weather data without needing a monitor.
- Internet Connection (optional): Allows for cloud data storage and remote access to the weather station.
Step 1: Setting Up the Raspberry Pi 5
- Download and install Raspberry Pi OS:
- Download Raspberry Pi OS from the official website.
- Use Balena Etcher to flash the OS onto a microSD card.
- Insert the card into your Raspberry Pi, connect a monitor and keyboard, and power up.
- Update and Upgrade:
- Open the terminal and update the OS to ensure all components work smoothly.
- Enable I2C and SPI (for Sensor Communication):
- Open the configuration menu:
- Go to Interfacing Options and enable I2C and SPI. These protocols allow the Pi to communicate with various sensors.
Step 2: Connecting Sensors to the Raspberry Pi
- Temperature and Humidity Sensor (DHT22):
- Connect the VCC pin on the DHT22 to the 5V pin on the Raspberry Pi.
- Connect GND to a ground (GND) pin on the Pi.
- Connect the data pin to GPIO 4 on the Pi.
- Barometric Pressure Sensor (BMP280):
- Connect VCC to the 3.3V pin on the Pi.
- Connect GND to a ground pin.
- Connect the SCL and SDA pins to the Pi’s SCL and SDA pins for I2C communication.
- Light Sensor (Optional):
- For a light-dependent resistor (LDR), connect one side to 3.3V and the other to a GPIO pin, with a resistor between the GPIO pin and ground. This setup allows the Pi to measure ambient light levels.
Step 3: Installing Necessary Libraries for Sensor Communication
To communicate with sensors, specific Python libraries must be installed on the Raspberry Pi.
- Install the DHT Library:
- Install BMP280 Library:
- Install libraries for I2C communication and BMP280.
- Verify Sensor Connections:
- Use
i2cdetect -y 1to ensure the sensors are recognized by the Pi. The terminal will display the I2C addresses of connected devices.
- Use
Step 4: Coding the Weather Station in Python
With sensors connected, create a Python script to read data from them and display real-time weather information.
- Import Libraries:
- Initialize Sensors:
- Specify the sensor type and GPIO pin for the DHT22.
- Read Sensor Data:
- Create functions to read temperature, humidity, and pressure data.
- Display Data:
- Use a loop to continuously read data from sensors and print it to the console.
Step 6: Visualizing Data with a Graphic Library
- Install Matplotlib:
- Modify the Code to Store Data:
- Store temperature, humidity, and pressure values in lists to plot them over time.
Step 7: Storing Data in the Cloud (Optional)
Storing your sensor data in the cloud allows you to track and analyze it over extended periods. This is particularly useful for monitoring environmental conditions like temperature, humidity, and pressure. By using cloud services, you can create a centralized data repository and access it from anywhere. Additionally, cloud storage offers scalability, security, and backup, ensuring your data is safe and readily accessible.
In this section, we’ll expand on setting up cloud storage and sending data to services like Google Sheets or AWS. We’ll also discuss how to analyze long-term trends using visualization tools.
1. Set Up a Cloud Service (e.g., Google Sheets or AWS)
Before you can send data to the cloud, you’ll need to set up an appropriate cloud service. Let’s go over two popular options: Google Sheets and AWS (Amazon Web Services).
Option 1: Google Sheets
Google Sheets provides an easy and free solution for storing data in the cloud. You can access your data in real-time, and it’s a great option for small projects or experimentation. Here’s how to set it up:
- Create a Google Sheet:
- Open Google Sheets and create a new spreadsheet where you want to store the data.
- Add headers in the first row, such as
Timestamp,Temperature,Humidity, andPressure.
- Enable the Google Sheets API:
- Go to the Google Cloud Console.
- Create a new project, then enable the Google Sheets API and Google Drive API.
- Create credentials (OAuth 2.0) for your application, download the credentials JSON file, and save it to your Raspberry Pi.
- Install Required Libraries: Install Python libraries needed to interact with Google Sheets:
- Authenticate and Access Google Sheets: Use the
gspreadlibrary to authenticate and send data to your Google Sheet. Here’s a simple Python code snippet for authentication and updating the sheet:After this setup, modify your Python code (from the weather station) to periodically send sensor data to Google Sheets.
Option 2: AWS (Amazon Web Services)
For larger projects or those requiring more advanced features (such as processing or storing large amounts of data), AWS offers powerful cloud services, including databases and storage solutions.
- Create an AWS Account and Set Up Services:
- Sign up for an AWS account at aws.amazon.com.
- Use services like AWS DynamoDB (NoSQL database) or AWS RDS (relational database) to store your data.
- Set up IAM (Identity and Access Management) roles and permissions to secure your database access.
- Install AWS SDK (Boto3): Install the
boto3library to interact with AWS services from your Python code: - Configure AWS Credentials: Set up your AWS credentials by configuring the AWS CLI or using environment variables. You’ll need your AWS Access Key and Secret Key.
- Store Data in AWS: Here’s an example code snippet that sends data to AWS DynamoDB:
This sends the data to the AWS DynamoDB table for later retrieval and analysis.
2. Send Data to the Cloud
Now that you have your cloud service set up, modify your Python script to periodically send the data from the weather station to the cloud. This ensures that data is continuously updated in your chosen platform for analysis.
For Google Sheets, you would use the
send_data_to_sheets()function mentioned earlier. You can call this function within your main loop to send data every 10 seconds:Similarly, for AWS, you can call the
store_data_in_aws()function to send data to DynamoDB at regular intervals.
3. Analyze Long-Term Trends
Once your data is stored in the cloud, you can analyze it to observe trends and make informed decisions about environmental monitoring or any other use cases for your weather station.
Data Visualization Tools:
- Google Data Studio (for Google Sheets):
- Google Data Studio allows you to create custom reports and dashboards using data stored in Google Sheets.
- Connect your Google Sheets data to Data Studio, create visualizations like line charts, bar graphs, and pie charts, and analyze the weather trends over time.
- AWS QuickSight (for AWS):
- AWS QuickSight is a business analytics service that can visualize data stored in AWS databases such as DynamoDB or RDS.
- You can create dashboards with a variety of visualizations and even perform complex analyses using AWS’s machine learning capabilities.
- Matplotlib (for Python-based Analysis):
- If you prefer analyzing the data within your Python script, you can use the
matplotliblibrary to generate visualizations locally. - Here’s an example of how to plot temperature over time using
matplotlib:
You can extend this approach to visualize humidity, pressure, and other environmental parameters.
- If you prefer analyzing the data within your Python script, you can use the
Setting up a personal weather station with a Raspberry Pi 5 is a rewarding project that provides practical insights into weather patterns and environmental data collection. By following this guide, you’ve created a real-time monitoring station capable of tracking temperature, humidity, and atmospheric pressure. The project is highly customizable, enabling you to add more sensors or integrate cloud storage, turning your weather station into a powerful tool for data collection and analysis. Enjoy exploring weather data from your own home, and consider expanding your setup for more advanced environmental monitoring.
Google’s official documentation provides in-depth details on how to use Google Sheets API with Python, manage authentication, and interact with cloud data. It’s an excellent resource for learning how to send and retrieve data from Google Sheets.
Website: https://developers.google.com/sheets/api
Please check out our other website, where you can learn how to 3D print some things needed for this project. https://master3dp.com/

