Transform your Banana Pi into a cutting-edge IoT weather station, monitoring temperature, humidity, and air pressure with ease. Learn how to set up and configure your device for real-time weather updates.
In an era of smart technology and connectivity, personal weather stations have become a valuable tool for monitoring local climates, conducting research, and contributing to global weather networks. With the versatile Banana Pi single-board computer, you can create an advanced IoT weather station that collects, analyzes, and shares environmental data in real time.
This guide will walk you through the process of turning your Banana Pi into a feature-rich weather station, covering hardware setup, software development, cloud integration, and advanced features.
Why Build an IoT Weather Station?
1. Real-Time Weather Monitoring
Building a weather station allows you to track localized weather conditions that might not be captured by regional weather services. Whether you’re a hobbyist, farmer, or researcher, having precise, real-time data at your fingertips is invaluable.
2. Educational and Professional Benefits
This project is a gateway to learning about IoT, programming, and hardware integration. For professionals, it can serve as a low-cost prototype for commercial systems.
3. Contribution to Weather Networks
You can share your data with global weather monitoring networks like Weather Underground or Citizen Weather Observer Program (CWOP), helping improve forecasts and climate research.
4. Cost-Effectiveness and Customization
Unlike commercial weather stations, DIY systems are affordable and customizable. You can tailor your station to include specific sensors or advanced functionalities like solar power or AI analytics.
Step 1: Gather the Components
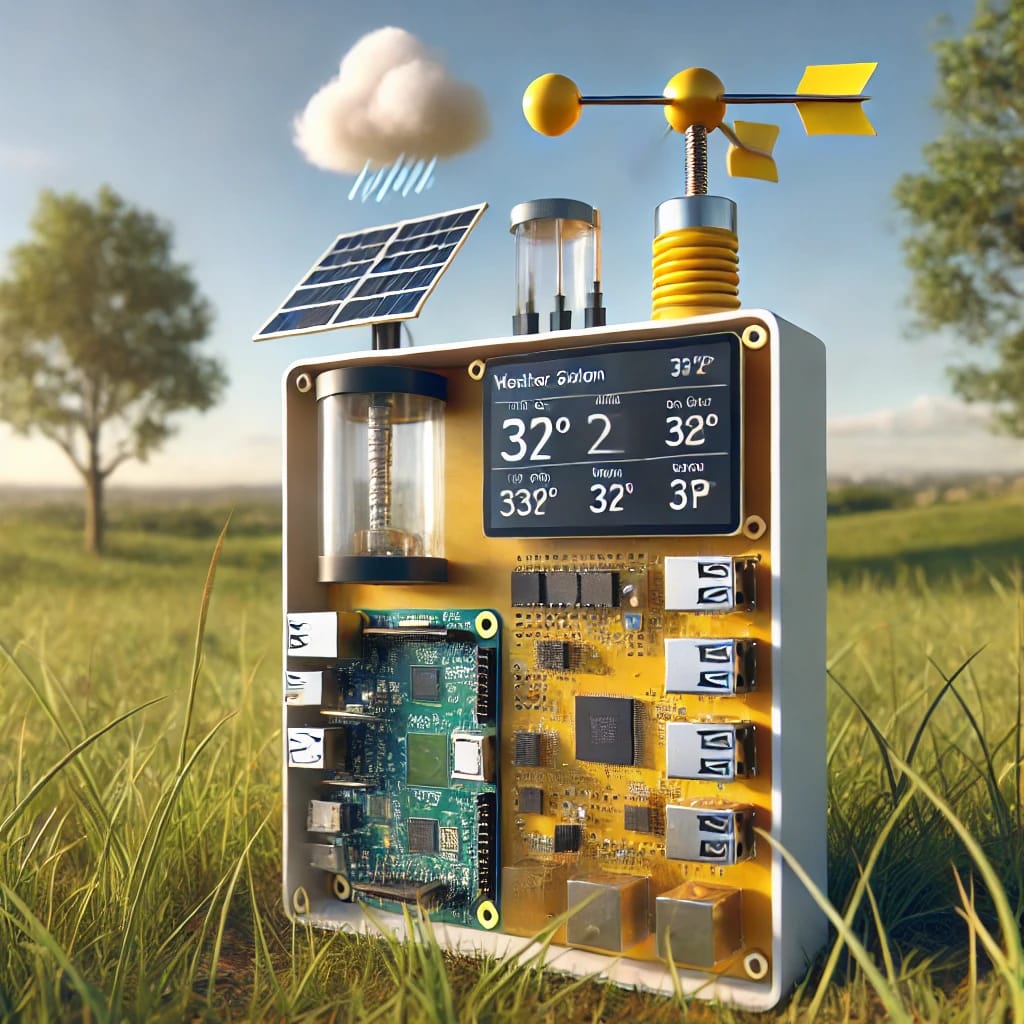
To build a fully operational weather station, you’ll need the following:
Hardware Requirements
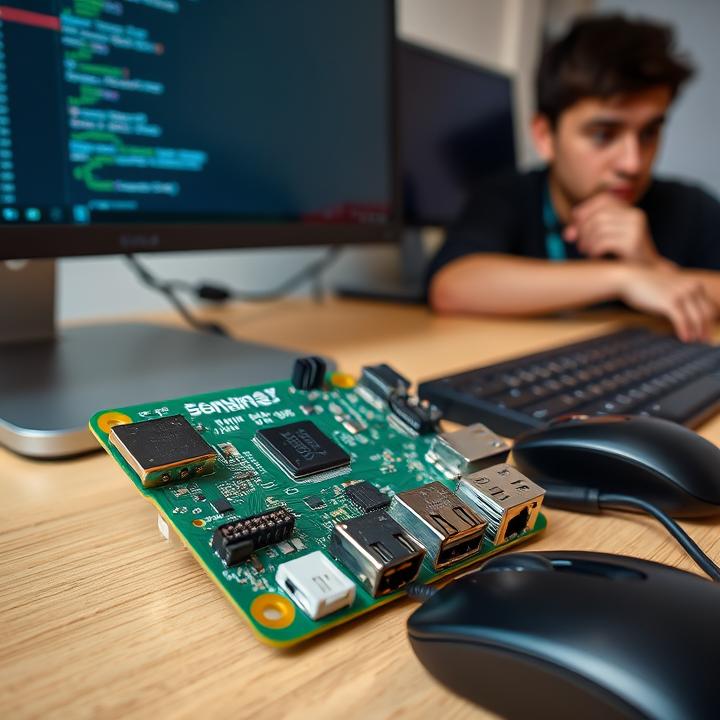
- Banana Pi Board: Any model with Wi-Fi or Ethernet capabilities and GPIO pins for sensor integration (e.g., Banana Pi M2 Zero).
- Sensors:
- DHT22: Measures temperature and humidity.
- BMP280: Tracks barometric pressure and altitude.
- Wind Speed and Rain Gauge: Optional but enhances data accuracy.
- Power Source: USB adapter or a portable battery.
- Enclosure: Waterproof housing to protect the station from the elements.
- SD Card: At least 8GB storage for the operating system and scripts.
Software Requirements
- Operating System: Banana Pi’s Raspbian or Armbian.
- Python Libraries: Libraries like
Adafruit_DHTandsmbus2for sensor data. - IoT Platforms: ThingSpeak or Adafruit IO for data visualization and sharing.
Step 2: Setting Up the Banana Pi
1. Install the Operating System
- Download a compatible OS like Banana Pi Raspbian from its official website.
- Flash the OS image onto the SD card using a tool like Balena Etcher.
- Insert the SD card into the Banana Pi and power it on.
2. Configure Network Access
Set up Wi-Fi or Ethernet connectivity for cloud data transfer. Use the following commands to configure Wi-Fi:
Add your network credentials and restart the device.
3. Install Dependencies
Update the OS and install essential libraries:
Step 3: Connect the Sensors
1. DHT22 (Temperature and Humidity)
- Connect the VCC pin to a 3.3V or 5V GPIO pin.
- Connect the GND pin to the ground.
- Connect the Data pin to a digital GPIO pin (e.g., GPIO4).
2. BMP280 (Barometric Pressure)
- Use the I2C protocol to connect the sensor.
- Connect SCL and SDA pins to the corresponding I2C pins on the Banana Pi.
3. Wind and Rain Sensors (Optional)
- Use additional GPIO pins for input, and calibrate the sensors using Python scripts.
Secure all components on a breadboard before placing them in a weatherproof enclosure.
Step 4: Write the Code
1. Sensor Data Collection
Create a Python script to read data from the sensors:
2. Cloud Integration
Send data to IoT platforms using HTTP POST requests. For example, with ThingSpeak:
Step 5: Visualize and Expand
Visualizing weather data is a crucial step in any IoT weather station project. It transforms raw data into meaningful insights that can be easily interpreted and analyzed. With Banana Pi, there are several powerful tools and techniques to visualize the data collected from sensors like temperature, humidity, pressure, and more. Let’s walk through some essential methods for data visualization and how to expand your project with advanced features.
Data Visualization Tools
-
ThingSpeak Integration ThingSpeak is an excellent platform for IoT data visualization. It provides an easy-to-use interface for storing and analyzing weather data collected from your Banana Pi. After setting up an account, you can create a “Channel” on ThingSpeak where each sensor value (temperature, humidity, etc.) will be logged. You can use ThingSpeak’s built-in charts and graphs to monitor real-time changes, analyze trends, and even set up alerts based on specific thresholds (e.g., a sudden rise in temperature or a drop in air pressure).
How to Set It Up:
- First, install the ThingSpeak library on your Banana Pi. Python has a well-documented
thingSpeaklibrary that can send data to your ThingSpeak account. - Send the sensor data (e.g., temperature, humidity) to ThingSpeak using HTTP requests via Python scripts. You’ll need to insert your API key to authenticate the request.
- Once the data is uploaded, you can create visual graphs, charts, and time-series plots on ThingSpeak. It also supports adding widgets like maps or tables to display data in different formats.
This easy integration allows you to remotely monitor your weather station from anywhere in the world.
- First, install the ThingSpeak library on your Banana Pi. Python has a well-documented
-
Local Visualization on a Web Server For more control over your data presentation, you can host a local web server on your Banana Pi to display sensor data in real time. Using frameworks like Flask or Django in Python, you can create a simple web interface that pulls sensor data and displays it on a webpage. This option is beneficial if you prefer not to rely on third-party platforms and want full control over the visualization process.
How to Set It Up:
- Install Flask, a lightweight Python web framework that simplifies server creation.
- Write a Python script that retrieves sensor data from your weather station (using libraries like
Adafruit_DHTfor temperature and humidity sensors). - Create HTML templates to display the data in a user-friendly format, such as a dashboard with real-time graphs.
- Use JavaScript libraries like Chart.js or D3.js to enhance the visuals, turning raw data into engaging charts or graphs that update in real time.
- If desired, you can also integrate other libraries like Bootstrap to improve the design of your website, making it responsive and visually appealing.
This local solution gives you complete flexibility in designing your weather station’s interface, while still maintaining full control over how the data is visualized and presented.
-
Integration with Google Sheets for Data Logging If you prefer using familiar tools like Google Sheets for data logging and visualization, you can integrate your Banana Pi with Google Sheets via Google’s API. This setup allows your weather station to log data directly into a spreadsheet, where you can easily create graphs, tables, and analyze the data over time.
How to Set It Up:
- Install the Google Sheets API and configure it to work with your Banana Pi. You will need to create credentials through Google Cloud Console to authenticate API requests.
- Write a Python script that sends data from your sensors to the Google Sheets API. Every time the sensor collects new data, your script will automatically update a row in the spreadsheet with the latest readings.
- Once the data is in the sheet, you can use Google Sheets’ built-in features to visualize the data with charts and graphs. These can then be shared online or accessed remotely.
-
Advanced Visualization with Grafana If you’re looking for more advanced data visualization, Grafana is an excellent choice. It’s an open-source platform used for monitoring and observing time-series data. Grafana can be paired with InfluxDB, a time-series database that stores your weather station’s data efficiently, enabling high-performance queries and visualizations.
How to Set It Up:
- Install InfluxDB on your Banana Pi and configure it to store data from your weather station.
- Install Grafana on the same system and link it to InfluxDB as the data source.
- Create customized dashboards in Grafana that visualize your weather data in real time. Grafana supports many visual formats, including graphs, tables, and heatmaps.
- You can configure Grafana to trigger alerts when certain conditions are met, such as when the temperature goes above a predefined value or the humidity falls below a certain threshold.
Grafana offers more flexibility and options for complex data analysis and visualization. It’s particularly useful for larger, more sophisticated weather stations that need powerful features like real-time alerts, multiple data sources, and detailed analytics.
Expanding Your Weather Station
-
-
Adding More Sensors One of the great things about using a platform like Banana Pi is the ability to expand your weather station by adding more sensors. While basic setups typically include temperature, humidity, and pressure sensors, you can add more to enhance your station’s capabilities. Some common sensors you can incorporate include:
- Wind Speed and Direction Sensors: These allow you to measure the wind’s velocity and direction, giving you a more complete view of your local weather.
- UV Index Sensors: Measure ultraviolet radiation levels, which can help with health safety and environmental analysis.
- Rain Gauge: As mentioned earlier, adding a rain gauge will enable you to track rainfall and understand precipitation patterns in your area.
- Soil Moisture Sensors: Useful for agricultural monitoring, these sensors measure the moisture levels in the soil, helping to predict conditions favorable for plant growth.
- Air Quality Sensors: Measure particulate matter (PM2.5) or gases like CO2, which can be essential for assessing air pollution levels.
Each sensor can be connected to your Banana Pi via its GPIO pins, and additional libraries or APIs can be used to process and display data from these sensors.
-
Remote Monitoring and Alerts As you expand your weather station, it’s important to have the ability to remotely monitor it, especially if you’re away from home or need real-time access. Setting up email or SMS alerts ensures that you can be notified of significant changes, such as severe temperature drops, high wind speeds, or sudden pressure changes. Platforms like ThingSpeak, Blynk, and Adafruit IO offer built-in alerting systems that can trigger notifications when data exceeds certain thresholds.
To set up email or SMS alerts, you can use services like Twilio for SMS notifications or IFTTT (If This Then That) for custom alerts triggered by specific data inputs.
-
Automating Responses with IoT Once your weather station is up and running, you can automate certain actions based on the data it collects. For example, if the temperature drops below a certain level, you could trigger a heater to turn on via a smart plug. Similarly, if the humidity reaches a certain threshold, you could activate a dehumidifier. This automation can be done through platforms like Home Assistant or OpenHAB, both of which integrate well with Banana Pi and IoT devices.
-
Transforming a Banana Pi into an IoT weather station is an enriching project that provides practical value and enhances your technical skills. From monitoring weather conditions to contributing to global networks, this project demonstrates the versatility of Banana Pi and its ability to integrate seamlessly with modern IoT ecosystems.
Start your weather monitoring journey today and explore the boundless possibilities of IoT technology!
FAQ: Building a Banana Pi IoT Weather Station
1. What is the advantage of using Banana Pi for a weather station?
Banana Pi stands out for its balance of affordability, processing power, and flexibility. Unlike simpler microcontrollers like Arduino, Banana Pi features a robust processor capable of running full operating systems like Linux. This allows it to handle more complex tasks, such as processing and visualizing weather data in real time, integrating multiple sensors simultaneously, and connecting to IoT platforms for remote monitoring. Additionally, its GPIO pins make it ideal for interfacing with sensors, and its Wi-Fi/Ethernet capabilities simplify cloud integration.
2. How accurate are the sensors used in this project?
The accuracy of sensors like the DHT22 (±0.5°C for temperature and ±2-5% for humidity) and BMP280 (±1 hPa for pressure) is sufficient for personal and educational projects. However, environmental factors, such as extreme heat, humidity, or poor placement, can affect their performance. For best results, sensors should be placed in a ventilated, shaded area and calibrated periodically. For professional applications, you might consider using higher-precision sensors like the SHT31 for humidity or the BME280 for combined temperature, pressure, and humidity.
3. Can the weather station operate offline?
Yes, the weather station can function offline by storing data locally on the Banana Pi’s SD card or an external USB storage device. Offline mode is particularly useful in remote locations without internet access. However, to retrieve data, you would need to manually transfer it to another device or use a local network for access. Tools like SQLite or CSV logging can help manage and organize offline data storage.
4. What IoT platforms are recommended?
Popular IoT platforms include:
- ThingSpeak: Offers simple data visualization and storage options with MATLAB analytics integration for advanced users.
- Adafruit IO: Provides intuitive dashboards and compatibility with many hardware platforms.
- Blynk: Focuses on mobile app-based control and visualization, making it perfect for remote monitoring.
- Google Cloud IoT Core or AWS IoT: Advanced platforms that allow for scalable, enterprise-grade IoT solutions.
Choosing the right platform depends on your needs. ThingSpeak is excellent for beginners, while Google Cloud is better for projects requiring advanced analytics and scalability.
5. Is this project beginner-friendly?
Yes, this project is accessible for beginners with basic programming and electronics knowledge. Step-by-step tutorials, libraries like Adafruit_DHT, and community support make it easier to get started. For novices, using pre-configured software or basic setups without cloud integration can simplify the process. However, as you gain confidence, you can explore more advanced features such as multi-sensor integration, AI-based analytics, and cloud automation.
6. Can I add rain detection to this setup?
Absolutely! You can integrate a rain gauge or a capacitive soil moisture sensor to detect rainfall or measure precipitation levels. A rain gauge typically uses a tipping bucket mechanism to count rainwater volume, sending digital pulses to the Banana Pi. Libraries or custom Python scripts can then process this input and log it alongside other weather data. For even greater accuracy, consider using an ultrasonic rain sensor, though it may require additional coding.
7. How much does this project cost?
The total cost depends on the components you choose. For a basic setup with a Banana Pi, a DHT22, and a BMP280 sensor, the cost can range from $50–$80. Advanced features, such as wind sensors, rain gauges, or solar panels, can increase costs to $100–$150. However, the long-term value of a customizable and scalable weather station often outweighs these initial expenses.
8. Can this project be powered sustainably?
Yes, you can use solar panels to power the Banana Pi and sensors, making the setup entirely off-grid. A 10W solar panel paired with a charge controller and a 5,000–10,000mAh battery should suffice for continuous operation. Energy-efficient coding, such as reducing logging frequency or disabling unused peripherals, can further extend battery life.
9. What are some advanced upgrades I can consider?
Advanced upgrades include:
- AI Integration: Use machine learning models to predict weather trends based on collected data.
- Multi-Sensor Arrays: Add sensors for UV index, soil moisture, or CO2 levels for agricultural applications.
- Mobile App Integration: Create a custom app for real-time monitoring and alerts.
- Weatherproofing: Build a robust enclosure with UV-resistant materials to protect the hardware from harsh environmental conditions.
- Edge Computing: Process data locally on the Banana Pi using lightweight AI frameworks like TensorFlow Lite.
10. How often should sensors be calibrated?
Sensor calibration frequency depends on usage and environmental exposure. For hobbyist applications, calibrating every 3–6 months is usually sufficient. Professional or scientific uses may require monthly calibration. Many sensors provide calibration protocols or require comparison against a trusted standard, such as a certified thermometer or barometer.
11. Can I share my data with weather networks?
Yes, platforms like Weather Underground and the Citizen Weather Observer Program (CWOP) accept data from personal weather stations. Sharing data involves configuring your IoT platform to send periodic updates to their servers. Joining such networks can improve regional weather forecasts and provide validation for your setup.
12. Is Python the only programming option?
While Python is the most accessible choice due to its extensive libraries, you can also use languages like:
- C++: Ideal for efficient, low-level operations.
- Node.js: Excellent for integrating IoT devices and handling asynchronous tasks.
- Java: Suitable for robust applications requiring cross-platform compatibility.
Python’s simplicity and active community support make it the best choice for most users.
13. Are alternative boards suitable for this project?
Yes, boards like Raspberry Pi, Arduino, or ESP32 can also be used. Raspberry Pi offers comparable features to Banana Pi, while ESP32 is highly energy-efficient and ideal for battery-powered setups. However, Banana Pi often outperforms its competitors in terms of affordability and processor capabilities, making it a preferred option for more complex IoT applications.
14. Can I expand this project into a weather prediction model?
Yes! Using historical data collected from your station, you can train machine learning models to predict weather conditions. Libraries like TensorFlow or Scikit-learn can help you develop regression models or neural networks to forecast temperature, humidity, or pressure trends. You’ll need a reliable dataset and some programming experience to achieve accurate predictions.
15. Where can I find support for this project?
Support is available from several sources:
- Banana Pi Forums: Engage with the official community for hardware-specific advice.
- GitHub: Explore repositories and code samples related to weather stations.
- YouTube: Tutorials can visually guide you through complex steps.
- IoT Forums: Platforms like Hackster.io or Stack Overflow provide troubleshooting and advanced tips.
Utilizing multiple resources ensures you’ll find solutions to most challenges.

